Saved rankings, the corrected historical simulation, methodology, and forward paper-test records—with their limits and next steps.
Sample outputs
Top-100 research ranking
This saved table shows the top 100 of 174 eligible names as of September 8, 2026. It exposes the alpha score alongside the original combined score, trend score, fair-value score, and liquidity fields so the ranking can be inspected rather than treated as a black box.
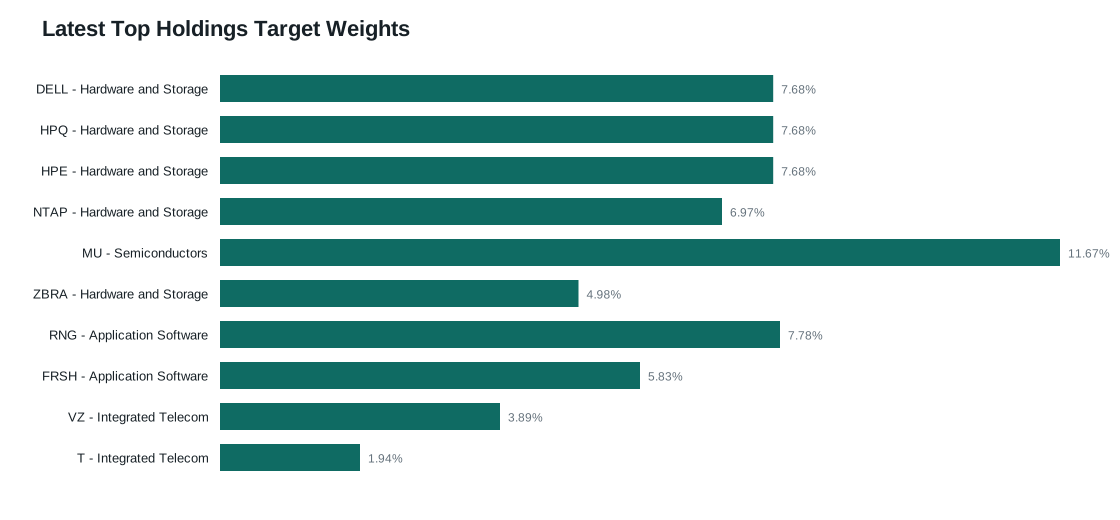
Updated holdings export: September 9 score anchor, September 10 simulated trade date. Bars show target weights, not score rank; they are not normalized to force full investment. This is separate from the September 8 ranking table and is not a suggested allocation. View full size ↗
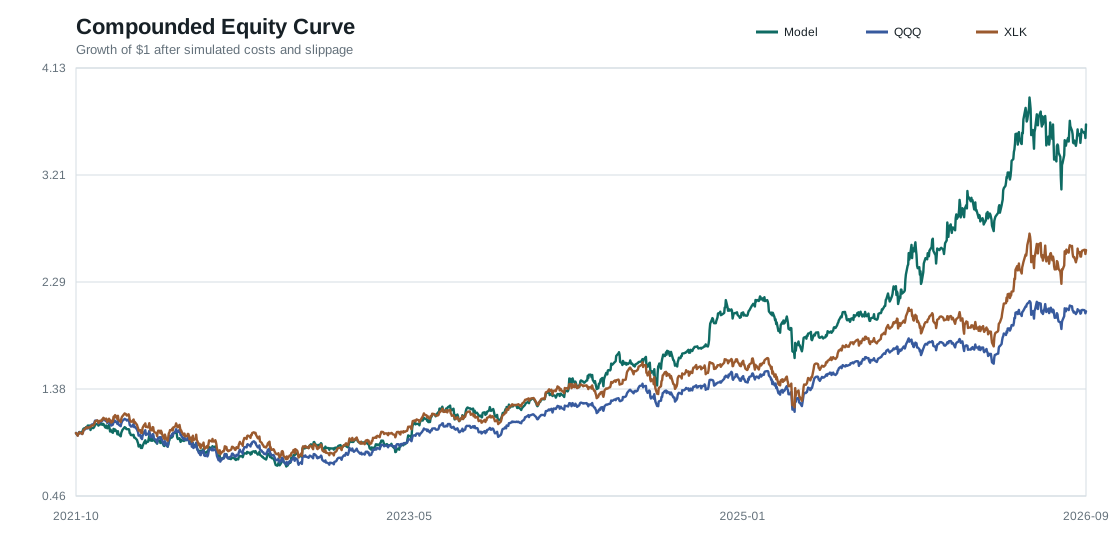
The saved fixed-family simulation runs from October 1, 2021 through September 11, 2026 using the top-10, rank-weighted setting and $30 million liquidity filter. The simulator includes transaction costs, slippage, liquidity and concentration limits, plus turnover tracking; the fixed website run does not enforce a hard turnover ceiling.
Updated September 12, 2026 · rebalance-day accounting corrected. The supplied rerun includes price movement before rebalancing and then applies trading costs. The export now runs through September 11, with 61 rebalances. Because the earlier export ended September 9, the change from +218.31% to +264.14% is not a same-window measurement of the accounting fix alone. These remain research simulations, not live returns. Read the methodology and limitations ↓
Backtest methodology · exact settings and accounting limits
These settings were checked against the corrected website-generation path, simulator, and refreshed rebalance log. They describe the main-period export shown here, not an assumption that every experiment used identical settings.
Settings behind the saved main-period backtest
Setting
Implementation
Scope and capital
Saved main-period simulation: October 1, 2021–September 11, 2026. Initial simulated capital is $100,000; charts normalize starting equity to 1. This is the fixed alpha family, not the dynamic model-selection or quarterly top-50 experiment.
Selection and weights
Select the top 10 eligible stocks by Alpha_Prototype_XLKCompetitive. Raw rank weights descend from 10 to 1 and sum to 55 before the concentration and liquidity caps are applied.
Rebalance schedule
Score anchors are generally monthly, followed by rebalancing on the next available trading date (a one-trading-day delay). The refreshed log contains 61 rebalances, from October 1, 2021 to September 10, 2026, including an additional September 9 score anchor. Prices are daily observations, not intraday execution quotes.
Liquidity filter
At least $30 million average daily dollar volume (ADV). The simulator averages price × volume over 20 trading observations, permits a minimum of 10 observations, and shifts the series one trading observation so the trade-date filter uses prior data.
Target position limits
At each rebalance, a position is capped at 15% of portfolio equity and at 2% of the stock’s ADV in dollar terms, whichever is tighter. Subindustry exposure is capped at 35%. These are target-weight limits; weights can drift between rebalances.
Transaction costs
10 basis points (0.10%) of gross traded value, counting both purchases and sales. This is applied to the sum of absolute stock-weight changes, not to the reported one-way turnover figure.
Slippage
5 basis points per 1% of ADV traded, scaled linearly for each stock. For example, a trade equal to 0.5% of ADV incurs 2.5 basis points on that trade’s value. This is a simulated assumption, not a measured execution cost.
Turnover and trade-size diagnostics
Turnover is half the sum of absolute stock-weight changes plus the absolute cash-weight change. A trade above 1% of ADV increments a breach counter but is not blocked or clipped. There is no hard turnover ceiling in this fixed run; the saved log reports zero trade-size breaches.
Cash and fallback
Unallocated weight remains in cash with zero modeled interest. After subindustry caps, excess weight is not forced into lower-ranked names. The fixed website simulation does not activate an automatic QQQ or XLK fallback.
Risk metric convention
The reported Sharpe ratio uses mean daily return divided by population standard deviation, annualized with √252. No risk-free rate is subtracted.
Accounting and comparison limits
Corrected rebalance-day accounting: existing holdings first receive the previous-close-to-rebalance-date price movement; the simulator then updates target weights and charges trading costs. The daily strategy return compounds these effects as (1 + price return) × (1 − cost) − 1. QQQ and XLK also receive that day’s price movement. In the supplied export, both benchmark returns are zero only on the initial starting row among the 61 rebalance rows.
Benchmark treatment: QQQ and XLK are price-return comparison series with no simulated trading costs. Their daily returns now include rebalance dates after the starting row. The simulated stock-universe portfolio is a separate, equal-weighted comparator using the portfolio constraints and cost model.
Missing daily returns: unavailable or non-finite returns are treated as zero. This is not a substitute for a verified delisting-loss policy, and historical-universe coverage remains incomplete.
Interpretation: the fixed score family was chosen through research, so the main period is not untouched out-of-sample proof. The corrected 2019–2021 comparison aligns both constructions and benchmarks to the same dates, but overlaps the main backtest from October 1 through October 15, 2021. It is not a wholly non-overlapping evaluation window, and the quarterly candidate was selected after exploring that period. The dated one-day forward snapshot is also separate evidence, not proof of reliability.
Source check: corrected model revision d6ece32; generate_website_assets.py, monthly_rebalanced_portfolio_simulator.py, portfolio_construction_validation.py, and portfolio_backtest_metrics.py, cross-checked with the supplied metadata, summary, equity series, and rebalance log. Updated website artifacts were generated September 12, 2026 at 5:29 p.m. EDT, following the original September 11 research summary. This page uses that supplied rerun; no additional simulation was run for the website update.
+264.14%Simulated total return
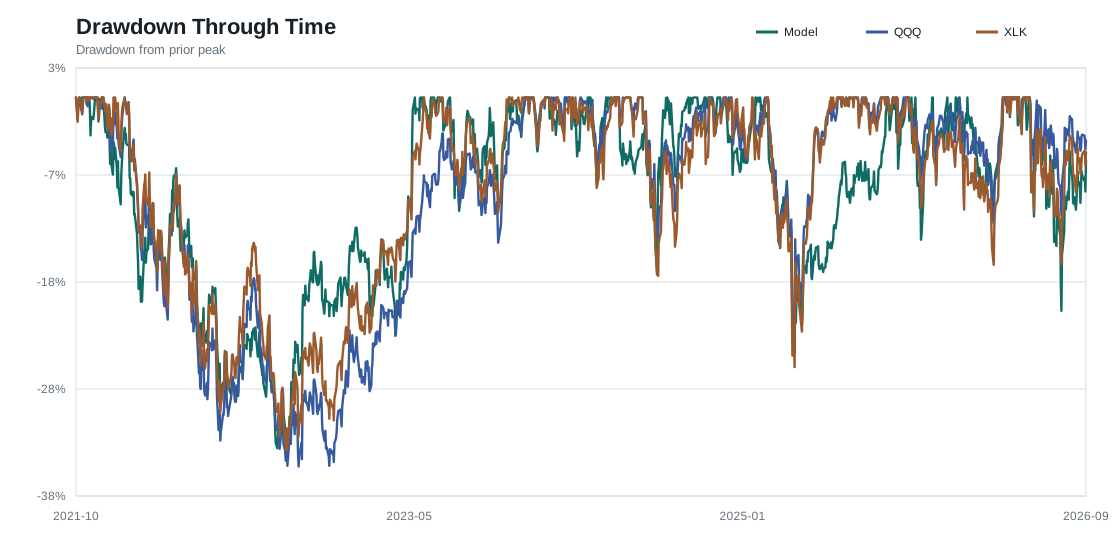
−34.03%Maximum drawdown
1.1142Reported Sharpe ratio
The reported cumulative return difference was +159.88 percentage points versus QQQ and +107.52 points versus XLK. Average turnover was 46.05%. These are historical simulation results, not realized investment returns.
Main-period equity curve from the supplied backtest export. View full size ↗Drawdown provides the risk context behind the return figure. View full size ↗Experimental fallback policy · separate from the main strategy
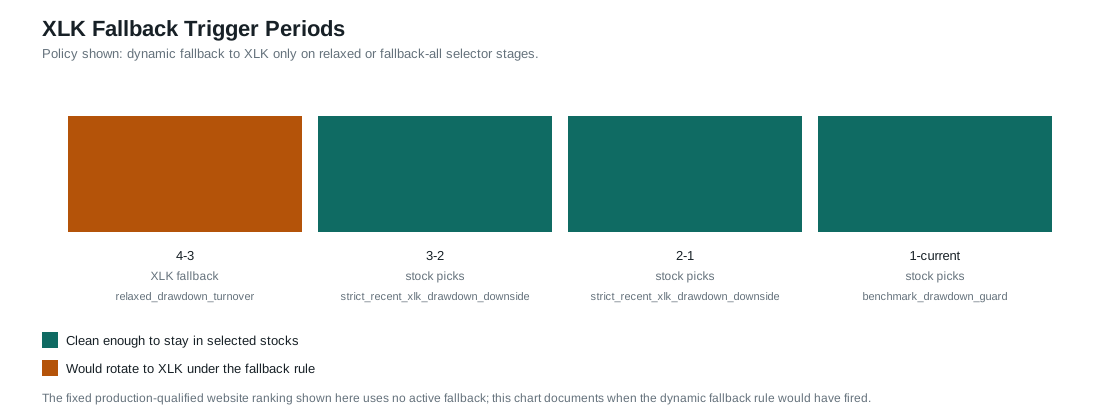
The chart below illustrates when a separate dynamic selection policy would rotate to XLK after its selection standards weaken. It does not show trades made by the fixed top-10 strategy above, which uses no active benchmark fallback. The underlying policy-selection records are separate research evidence, not a newly validated fallback backtest.
Fallback-policy illustration supplied with the updated exports. This is context for a separate experimental policy, not a component of the fixed-strategy equity curve. View full size ↗
The corrected September 12, 2026 rerun keeps Alpha_Prototype_XLKCompetitive unchanged, with the $30 million liquidity filter and rank-weighted allocation. It compares a monthly top-10 portfolio with the quarterly top-50 candidate, including rebalance-day price movement before target changes and trading costs.
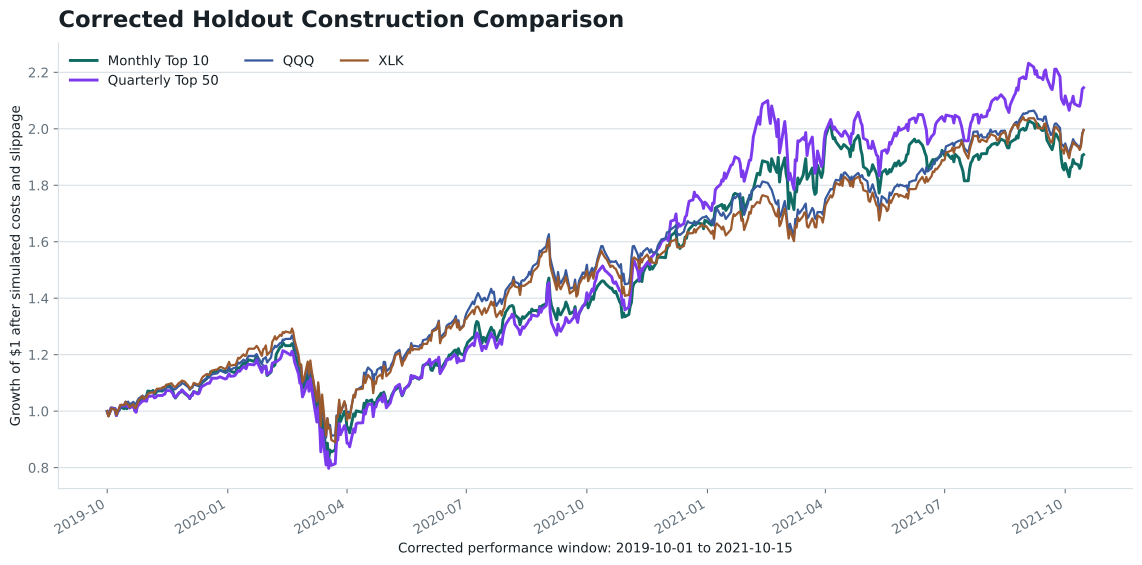
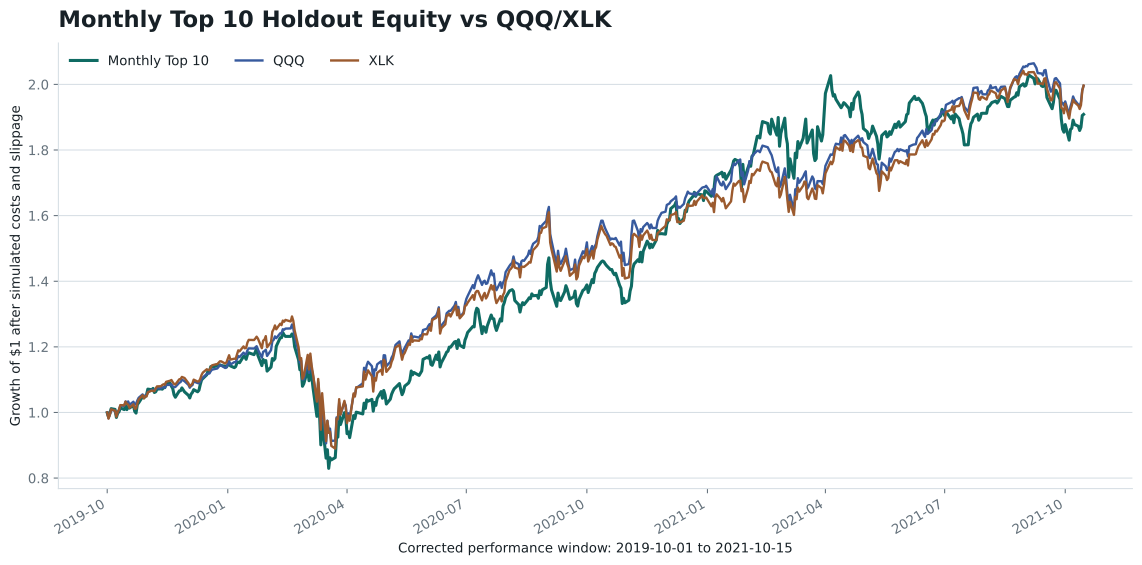
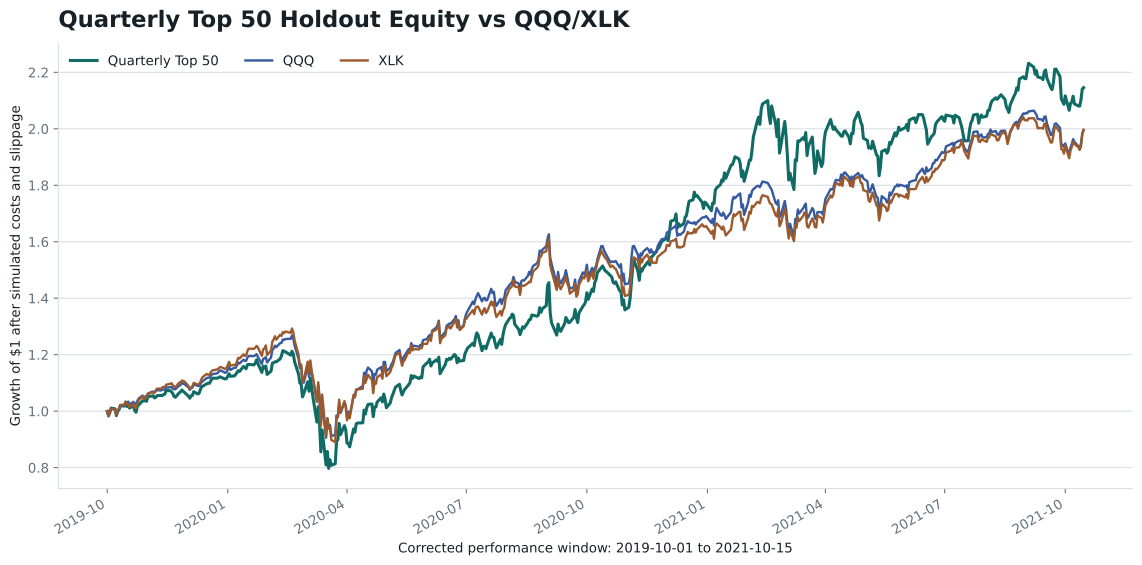
Aligned evaluation windows. Both simulations run from October 1, 2019 through October 15, 2021—516 trading days. The source score-anchor window is September 30, 2019 through August 31, 2021. Monthly top-10 uses 24 score anchors/rebalances; quarterly top-50 uses 8. QQQ and XLK are compared over the same performance dates.
Overlap with the main backtest: The main test begins October 1, 2021, so the two evaluation periods overlap from October 1 through October 15, 2021. “Aligned” means the two older-period constructions and their benchmarks share dates; it does not mean this window is wholly separate from the main backtest.
Corrected 2019–2021 results · pp means percentage points
Metric
Monthly top 10
Quarterly top 50
Simulated total return
+90.86%
+114.55%
QQQ return · same dates
+99.54%
+99.54%
XLK return · same dates
+99.64%
+99.64%
Excess vs QQQ
−8.69 pp
+15.01 pp
Excess vs XLK
−8.79 pp
+14.91 pp
Sharpe ratio
1.1943
1.3087
Sortino ratio
1.4863
1.5541
Maximum drawdown
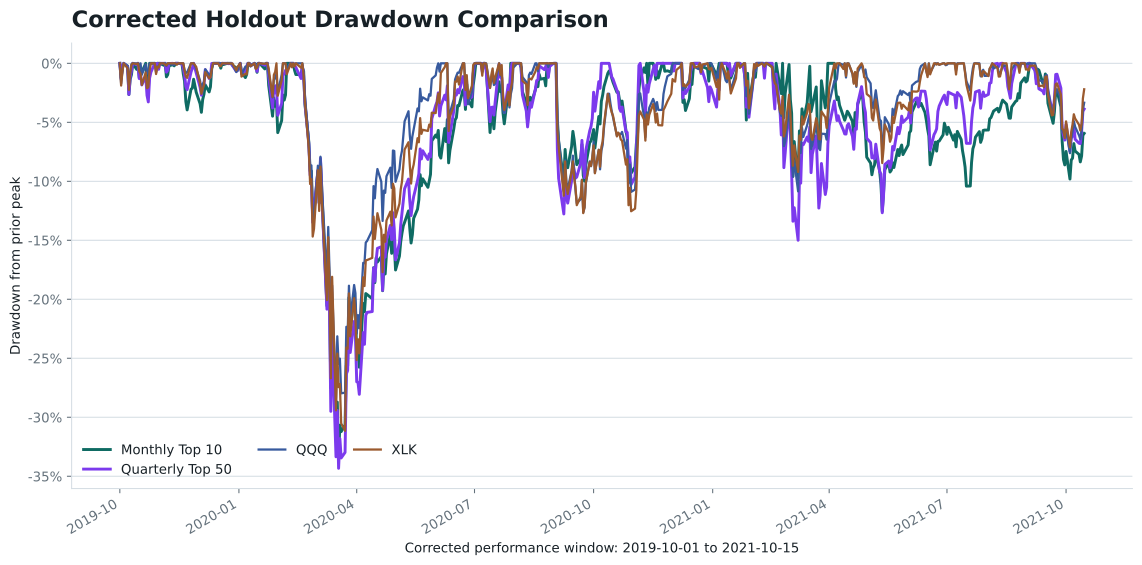
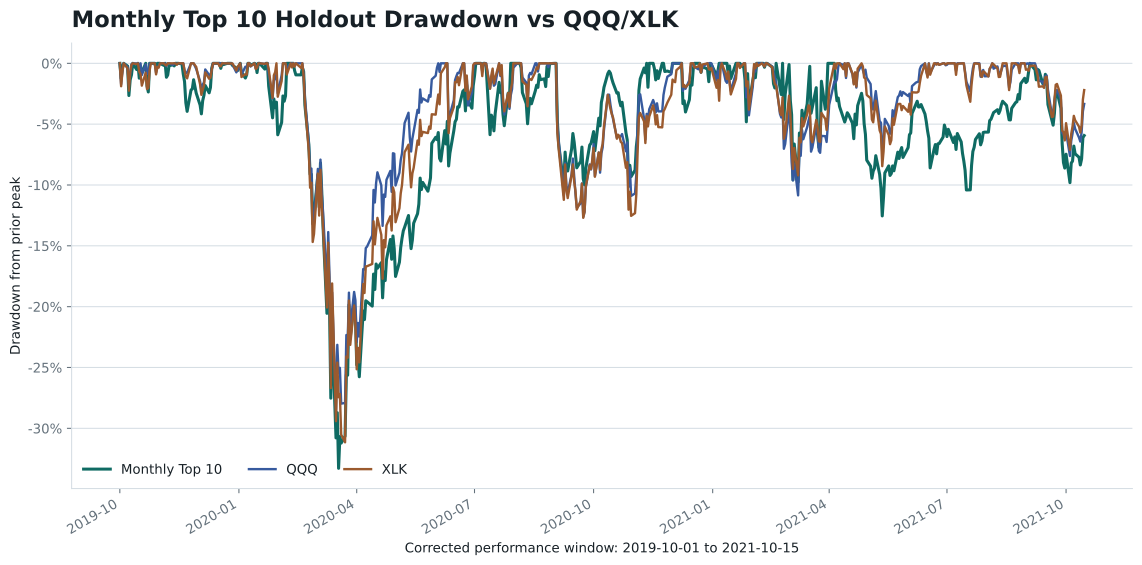
−33.29%
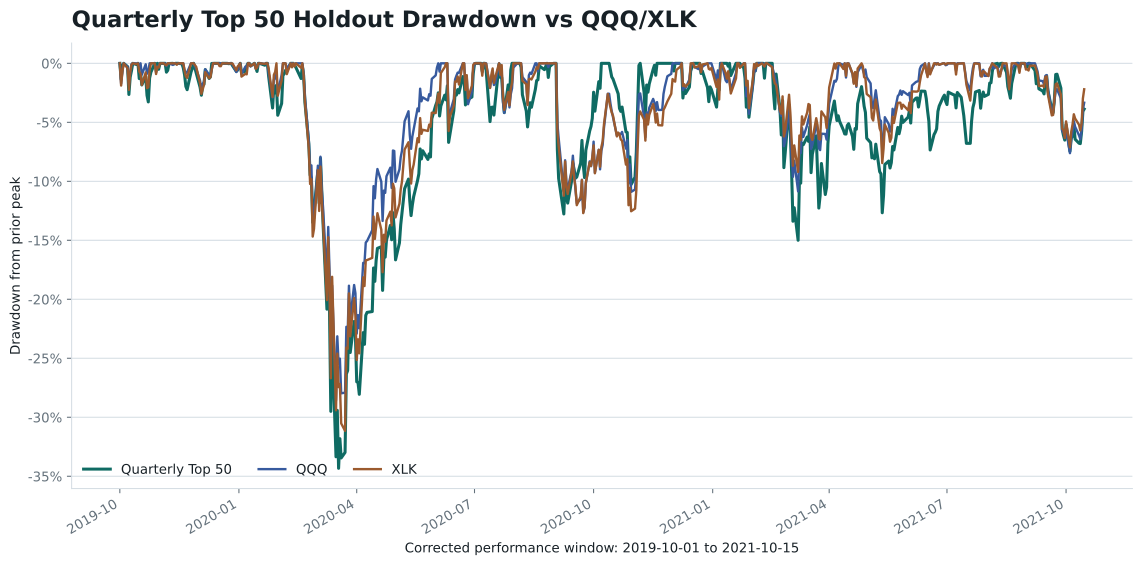
−34.32%
Average turnover per rebalance
54.93%
58.40%
Sum of rebalance cost fractions
2.38%
0.83%
Rebalances
24
8
Excess returns are calculated from unrounded exports, so subtracting rounded percentages may differ by 0.01 percentage points. Turnover is averaged per rebalance, not per year. The cost row sums the simulator’s rebalance cost fractions; it is not the percentage-point reduction in compounded return.
What the comparison shows
Monthly top-10 still trails both benchmarks. Quarterly top-50 beats QQQ and XLK over these same dates, but its maximum drawdown is slightly deeper than monthly top-10. The result supports further testing of diversification and rebalance frequency; because both changed together, it does not isolate which change caused the improvement.
Aligned performance window: October 1, 2019–October 15, 2021. Strategy curves include modeled costs and slippage; benchmark comparison curves do not incur simulated trading costs. View full size ↗The quarterly candidate’s higher total return did not produce a shallower maximum drawdown than monthly top-10. View full size ↗Individual construction chartsMonthly top-10 · 24 rebalances · same October 2019–October 2021 performance window. View full size ↗Monthly top-10 · corrected downside history. View full size ↗Quarterly top-50 · 8 rebalances · same October 2019–October 2021 performance window. View full size ↗Quarterly top-50 · corrected downside history. View full size ↗
Useful evidence, not a fresh untouched test. The quarterly top-50 candidate was selected after exploring this older period. Correcting the accounting does not reset that model-selection history. The historical universe is coverage-limited and backfilled from the project universe. This rerun does not establish live robustness or validate quarterly top-50 on the main 2021–2026 window. The website default remains top 10.
Forward paper test
Testing on unseen days without placing trades
A paper-test tracker records a hypothetical portfolio against new prices, without connecting to a broker. The supplied snapshot began September 9, 2026 with $100,000 of paper capital. By the September 10 mark, equity was $98,515.71: a −1.48% return after just one unseen trading day.
That snapshot lagged QQQ by 0.42 percentage points and XLK by 0.07 points. One day is far too little evidence to judge reliability. The project protocol targets an initial review around 60 unseen trading days and a longer review at 120 or more.
This is the saved September 10, 2026 paper-test snapshot, not a live paper-trading feed. No live trading performance is claimed.
Limits & next steps
Keep comparisons honest: results depend on the selected universe, available data, simulation assumptions, and model-selection process.
Add search-interest signals: connect a Google search-trends source to measure whether attention around each stock, product, or company theme is rising or fading. This should be tested as a separate feature before it is allowed to change the alpha score.
Study financial-media transcripts: add a licensed transcript source for market and stock-focused TV networks, then track how often a ticker is mentioned, whether the surrounding language is pessimistic or encouraging, and how the stock performs one day, one week, one month, and one year later.
Validate any buy/hold/sell adjustment: transcript and search signals should only affect simulated buy, hold, trim, or sell decisions after out-of-sample testing shows they improve return, drawdown, and benchmark-relative performance.
Only selected presentation outputs and code screenshots are included here. Raw vendor datasets, credentials, and data-provider integration code are not included in this website. Data-licensing requirements, especially for search APIs and TV transcript archives, remain a separate item to resolve before any broader release.